Market Insight
September Market Update: What the Numbers Really Mean

Tory Akene, REALTOR®
October 14, 2026 · 6 min read
After our North Group team's September market update, I wanted to share the highlights with you. There has been a lot in the headlines lately, so let's look at what the numbers actually mean for buyers, sellers and homeowners.
The Missing 22,000
Headlines have focused on buyers leaving the market, but the data tells a different story. From January to September, GTA sales were nearly flat year over year: 47,380 homes sold compared to 47,834 last year, a dip of less than one per cent. New listings tell the real story: 131,000 this year versus 153,000 last year, a drop of 14.4 per cent. That is about 22,000 fewer homes listed. Buyers are still here. There just are not as many homes to choose from, and that is a big part of why prices have held steady instead of falling further.
September in Context
This September, sales came in just over 5,000, down 9 per cent from last September. That sounds dramatic, but context matters. The average September since 2022 is 5,057 sales, so this year is right in line with the last four. Before 2022, Septembers averaged around 8,500 sales. When rates rose in 2022, the market settled at a lower level and has stayed there since. Compared to 2022, 2023 and 2024, this September was normal, if not slightly ahead.
Prices and Inventory
The average price in September was just over $1,000,000, down 5.1 per cent from last year. Active listings sat at just over 26,000, down 9.3 per cent, and days on market held steady at 51. One encouraging number: sales per 100 new listings rose to 30.5 from 28.7 last year, which means the homes being listed are seeing relatively more interest than they did a year ago. Prices have also been remarkably stable. From July to September, the average price moved within a narrow $13,000 range, less than one per cent of the average price. With about five months of inventory, the GTA overall sits in a balanced market.
Segment by Segment
Semi-detached homes are the strongest segment, with prices up 2.1 per cent in the 416. Detached homes are down 5.1 per cent across the GTA. Townhomes are down 4.6 per cent, with sales down 12.8 per cent. Condo apartments are feeling the most pressure, down 7.7 per cent across the GTA and 12 per cent in the 905. For every 100 active condo listings, only 16 sell, so condo buyers have real room to negotiate. Well-priced, well-presented homes are still selling, especially in desirable, family-friendly neighbourhoods, and that holds true in communities like Woolwich where growing families are looking for space and good schools.
Why Everyone Is Waiting
Inflation sits at 3 per cent, right at the top of the Bank of Canada's target range. The overnight rate has held steady at 2.25 per cent all year, and the next announcement is October 28. A 0.5 per cent rate increase would add about $14 per month for every $100,000 borrowed, so about $70 on a $500,000 mortgage. It is not huge, but it sends a signal, and it can push some buyers to hold off. TRREB's chief market analyst points to substantial pent-up demand in the GTA, but that demand needs confidence in job security and borrowing costs before it turns into sales.
New Construction
CMHC's latest report shows new condo starts in Toronto at historic lows, with only 156 units initiated in the first half of 2026, compared to a ten-year average of about 7,000 units a year. Freehold starts are down too. Fewer homes built now means fewer listings down the road. That is a longer-term story, not next spring, but it matters for anyone thinking about timing.
What It Means for You
For buyers, there is choice and room to negotiate, especially in the condo market. For sellers, there is less competition: about 2,800 fewer new listings this September than last. The strategy that works is the same in any market: price it well, present it well, and list it in the right neighbourhood. For homeowners, the most useful number is what homes like yours are selling for nearby, not the GTA average.
One more date worth noting: October 26 is the Ontario municipal election, which could bring changes to things like land transfer tax, property taxes and housing approvals. We will be watching both dates closely.
What This Means Here in Woolwich
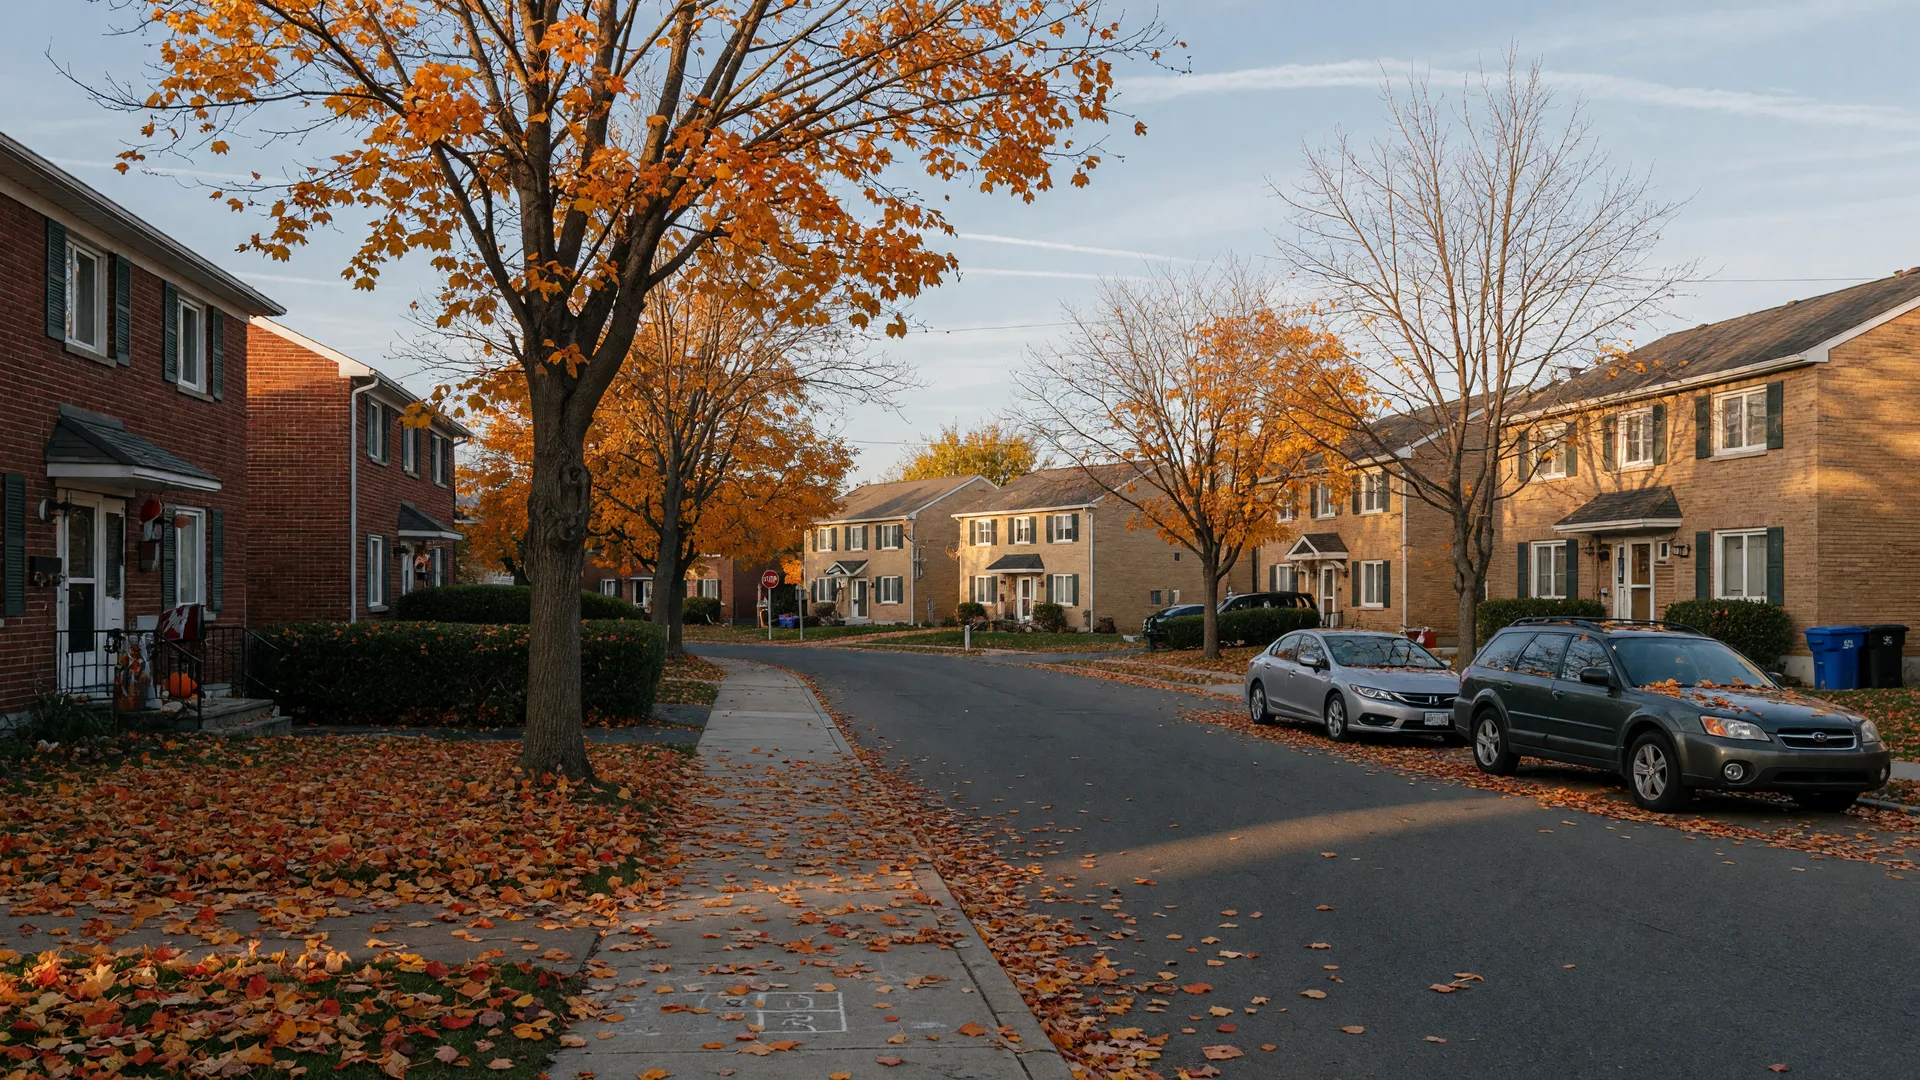
A lot of what I just shared is GTA-wide data, and the local picture can look different in its own way. In communities like Woolwich, well-priced, well-presented homes are still drawing steady interest from growing families who want space and good schools close to the Kitchener-Waterloo corridor. If you have been wondering how these numbers apply to a home like 31 Townsend Dr #66, I would be happy to walk you through it.
Our team at North Group had a fantastic September, and it is a reminder that while the market waits, motivated people are already thinking about their next move. If you would like to talk about what these numbers mean for your plans, I would love to help. Reach out anytime and we can book a time to chat.
Not sure what these numbers mean for you?
Whether you are buying, selling or simply staying put, I would love to talk through how the market looks for your situation. Let's book a time to chat.
Please note: this article is general information only and is not financial or legal advice. Figures referenced are from publicly reported market sources. Every situation is different, so be sure to speak with a mortgage professional about your own circumstances before making a decision.